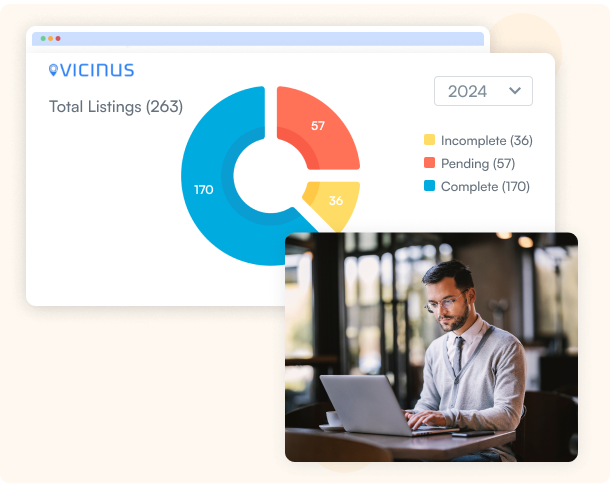
Analytics

Analytics to make data-driven business decisions

Analyse key performance indicators (KPIs) to optimise strategies – leading to enhanced online presence and reputation.
Why is data analytics vital for business?

90%

Organisations achieved significant value from data and analytics in 2023 data and analytics in 2023

60%

Companies around the world use data and analytics to improve cost efficiency 

86%

Insight-driven businesses continually act on intelligence to boost outcomes

Gains through data analytics and
 actionable insights

Location-specific analytics help to optimise listings and tailor your products or services for targeted reach.

Implement real-time updates to your listings based on dynamic analytics for current and relevant information.

Incorporate machine learning algorithms for content recommendations to personalise customer experience.

Use findings of visibility and conversion metrics to stay ahead of the competition.

Get insights into listings health, review summary, and call to action through periodical reports.

Export data-driven analytics reports and share them with your teams and stakeholders.
How Vicinus works

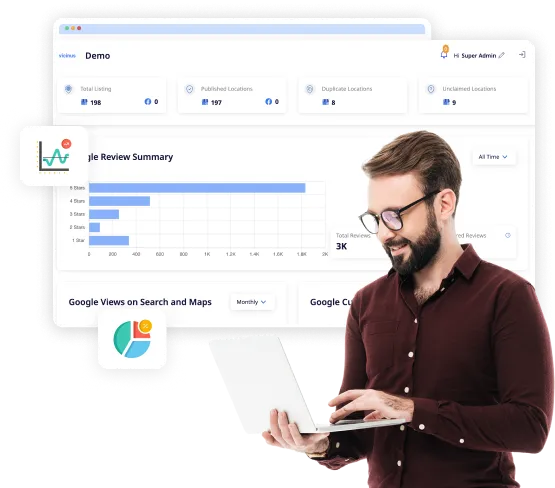
Customisable analytics dashboard

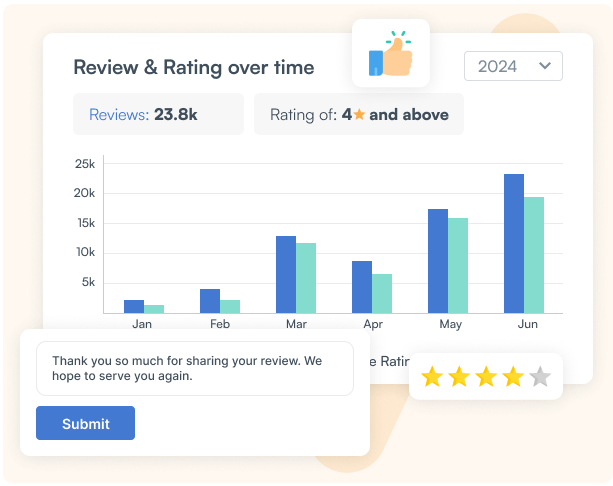
Tailor your reports based on specific metrics and key performance indicators (KPIs), such as average rating, response time, and customer demographics. This helps you easily view the data you exactly need to make data-driven decisions

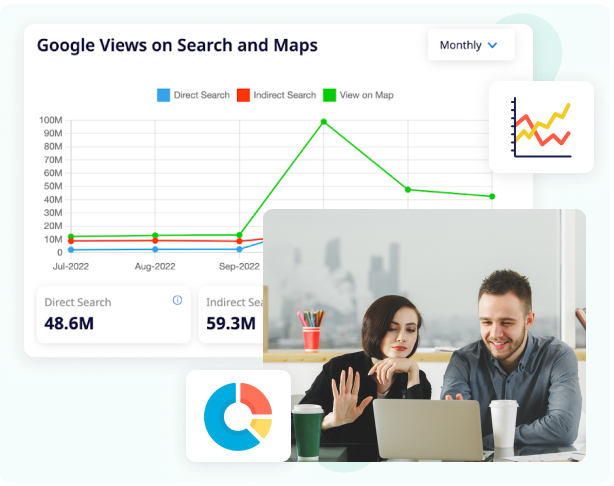
Key performance indicators

Vicinus analytics helps you track your search keywords, views, clicks, and calls to action over time and across locations. Get reports on how your focus keywords are performing locally to increase visibility and modify strategies accordingly
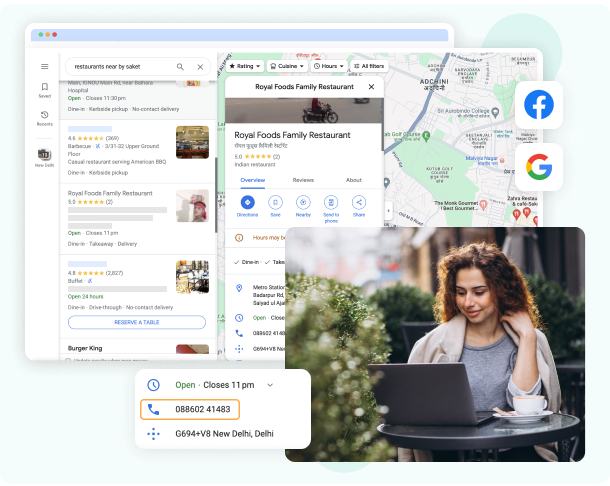
GMB and Facebook reports

Get location-specific insights into which actions online users are taking on GMB and Facebook listings. For example, Vicinus helps you track how many customers are clicking to call your business or get directions via Google Maps

Filter and segment reviews

Vicinus allows you to drill down into specific review categories, demographics, or products/services. This feature helps you pinpoint areas of strength or improvement, tailor strategies to specific customer segments, and refine your overall customer satisfaction

Sentiment trend analysis

Vicinus provides detailed insights into the specific language customers use to express their opinions. This allows you to better customise your responses, address concerns more effectively, and align your strategies with the evolving sentiments of customers

Detailed analytics reports

Generate detailed analytic reports, providing insights into customer engagement with your business online. This helps you better understand how users interact with your online presence and make informed decisions to enhance your overall digital strategy

Names that have trusted us

What they have to say about us

"Vicinus has helped us grow the Hyperlocal channel for the Reliance Trends network of stores. It provides us with a good toollkit to manage Trends network of over 2400 stores and grow the hyperlocal channel for 2000+ stores."

India

Reliance Trends

India

"Vicinus has helped us grow the Hyperlocal channel for the Reliance Trends network of stores. It provides us with a good toollkit to manage Trends network of over 2400 stores and grow the hyperlocal channel for 2000+ stores."

India

Reliance Trends

India

"Vicinus has helped us grow the Hyperlocal channel for the Reliance Trends network of stores. It provides us with a good toollkit to manage Trends network of over 2400 stores and grow the hyperlocal channel for 2000+ stores."

India

Reliance Trends

India

Frequently asked questions

Data analytics plays a critical role in optimising your local SEO strategy. By analysing data from various sources, you can gain valuable insights into how your local search efforts are performing and identify areas for improvement. Understanding user behaviour, measuring local SEO performance and taking data driven decisions becomes easier and concrete through data analytics
Data analytics generates reports that help identify trends, optimise content, track performance, get insights and manage online reviews, enhancing visibility and credibility.
A customisable dashboard allows you to focus on metrics that matter most to your business, providing tailored insights and efficient monitoring.
“Common KPIs used in data analytics include:
Insights generated per month: Measures the effectiveness of data and analytics teams in finding and understanding data patterns.
Accuracy of predictions: Tracks the accuracy of predictions made by data science models.
Speed at which results are generated: Evaluates the speed at which data analytics teams can generate results.
Number of decision-makers using analytics regularly: Indicates the level of adoption and value derived from analytics.
Percentage of uptime for systems and data pipelines: Measures the reliability of data engineering teams.
Customer feedback insights include satisfaction levels, common issues, suggestions for improvement, and overall customer sentiment.
Data-driven reports transform assumptions into informed decisions. By revealing hidden trends and customer behaviors, they mitigate the risk of biased choices. These reports identify opportunities to streamline processes and conserve resources. Data analysis enables the anticipation of future challenges and opportunities, providing a strategic advantage for your business. Additionally, data fosters accountability by demonstrating the impact of decisions on performance. In summary, data-driven reports are essential tools for making smarter and more effective decisions.
Competitor analysis is key to staying ahead. Identify both direct and indirect competitor. Choose metrics that matter to your business, like customer sentiment. Gather data from reliable sources like social media and reports. Analyze the data to find areas to improve and learn from competitor strengths. Regularly revisit your analysis as the market changes. By following these steps, you can turn competitor analysis into a tool for constant improvement.
Vicinus Analytics provides valuable insights into customer behavior, trends, and preferences. It allows you to monitor campaign performance, website traffic, and engagement metrics, enabling informed decision-making to optimize marketing strategies and resource allocation. By leveraging data-driven insights, Vicinus Analytics helps you gain a competitive advantage, improve ROI, and enhance customer experiences through tailored strategies and targeted initiatives.

Still looking for an answer?

Drop us an email and we will get back to you within 24 hours.

Are you ready to accelerate your business with the Vicinus edge?